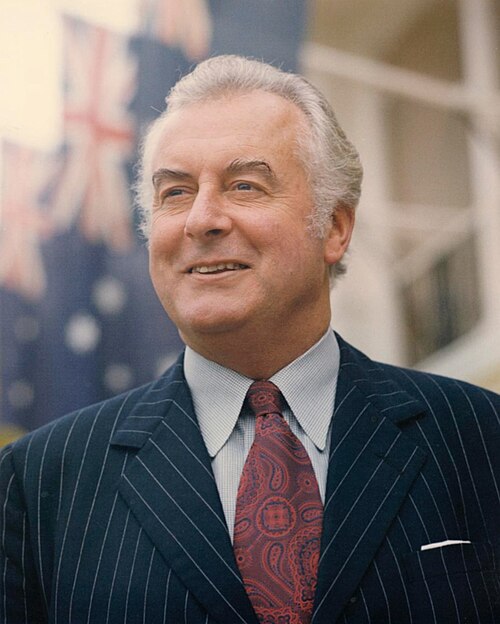
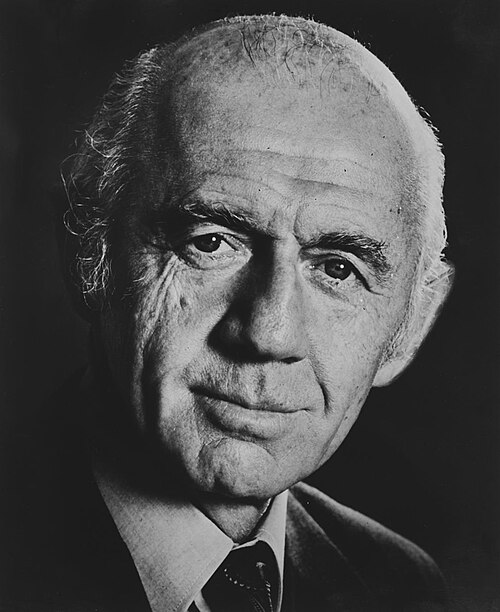
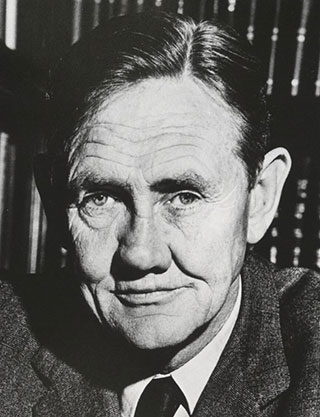
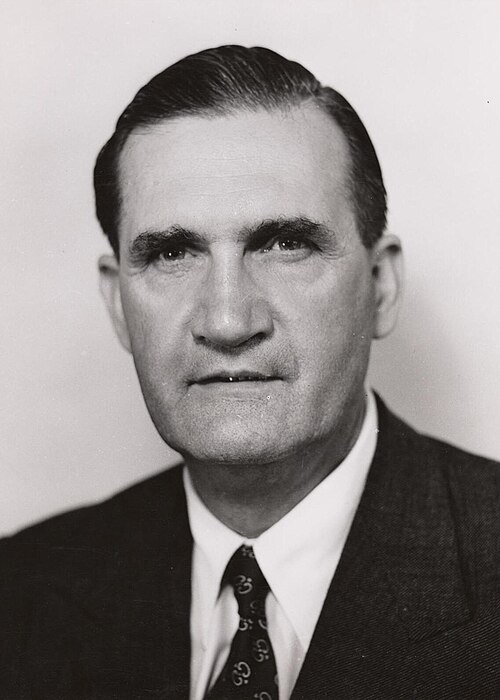
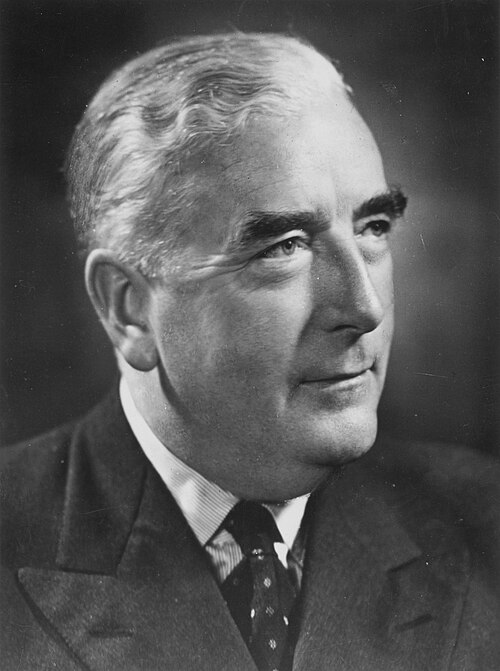
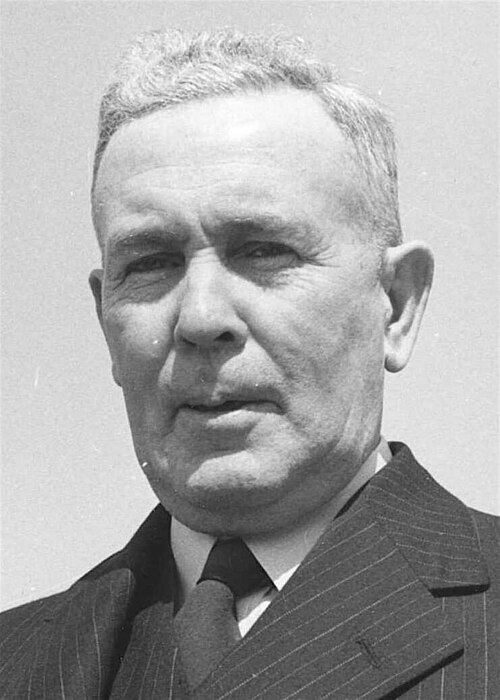
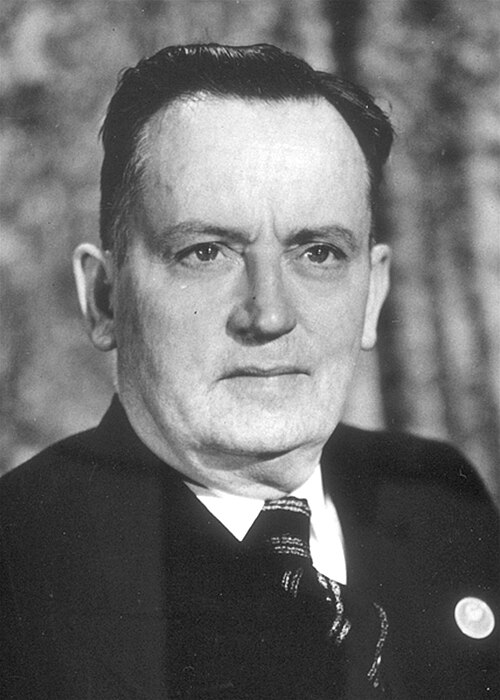
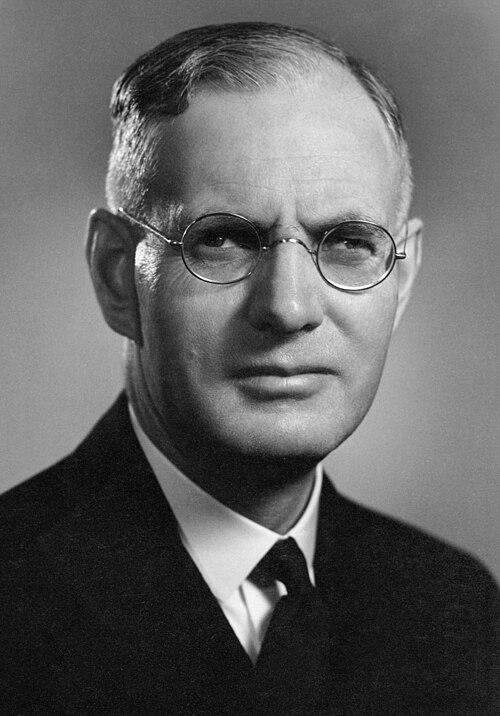
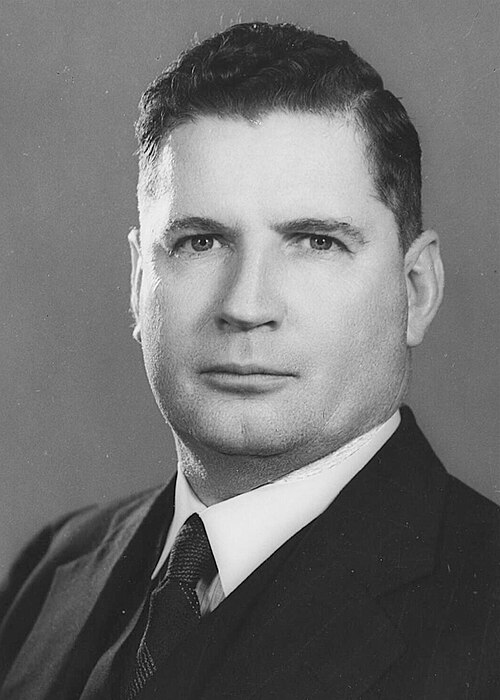
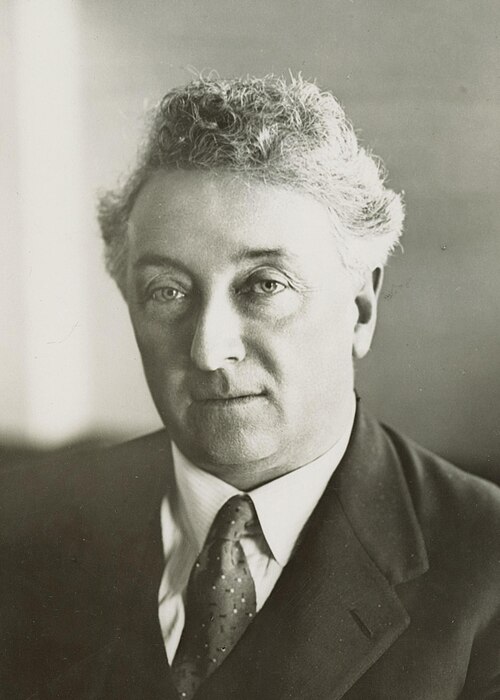
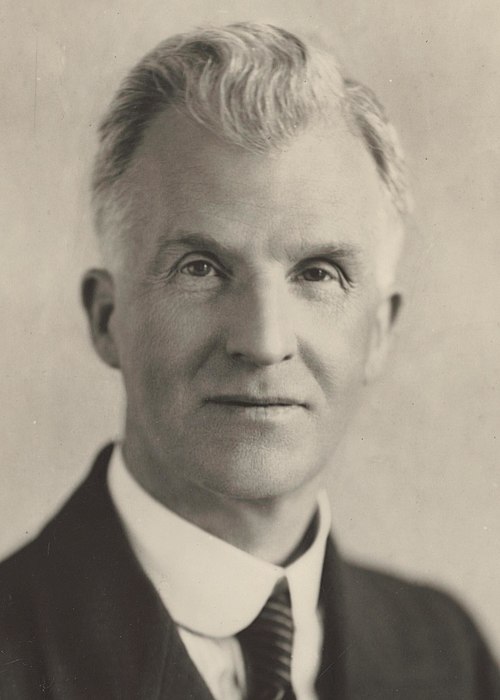
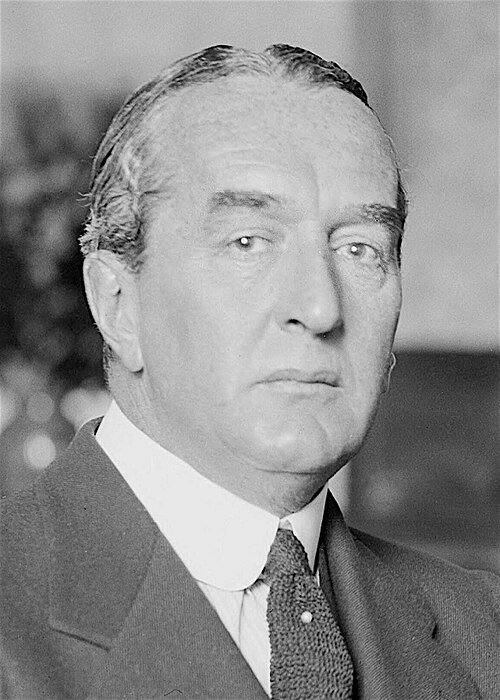
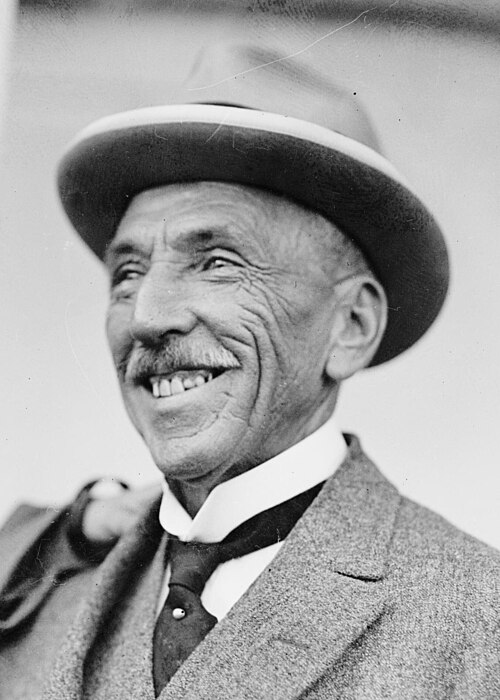
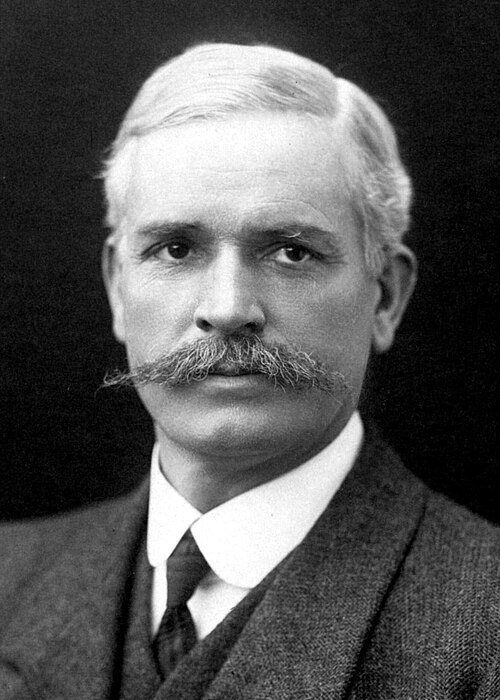
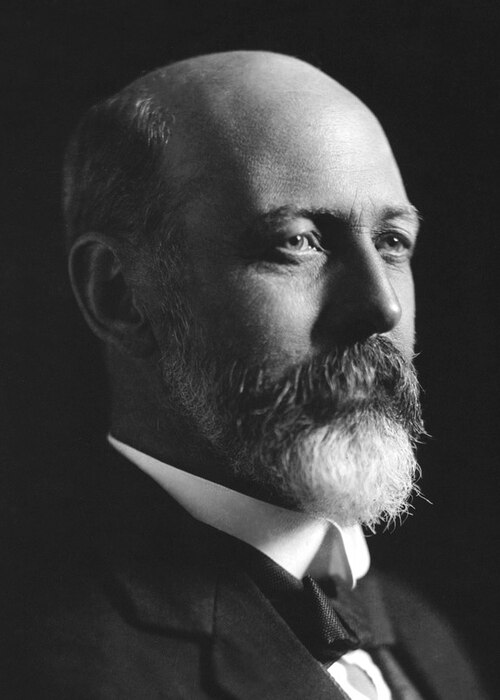
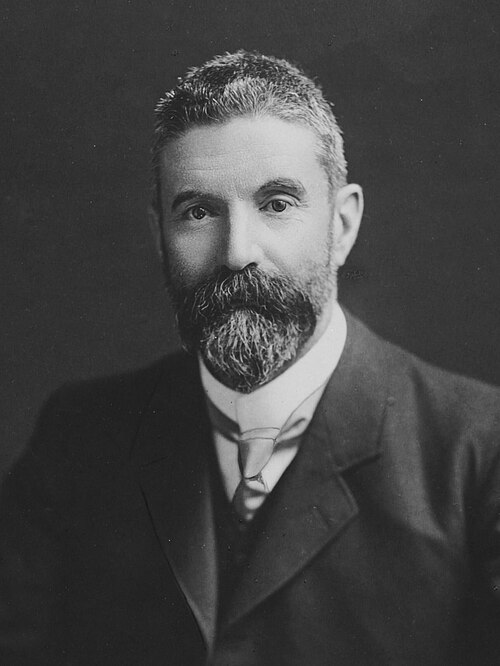
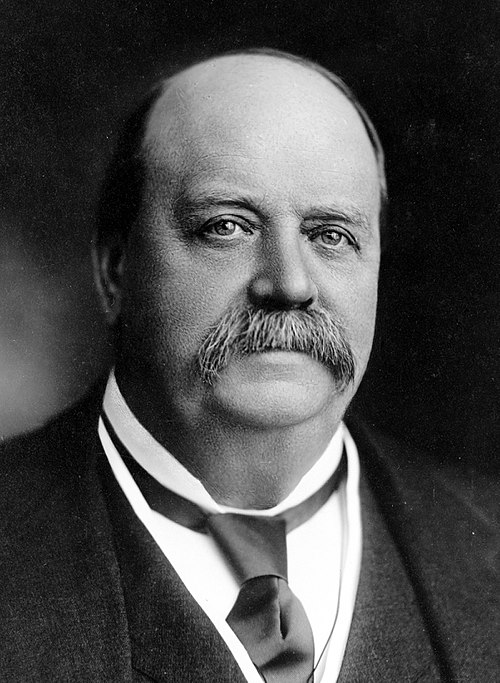
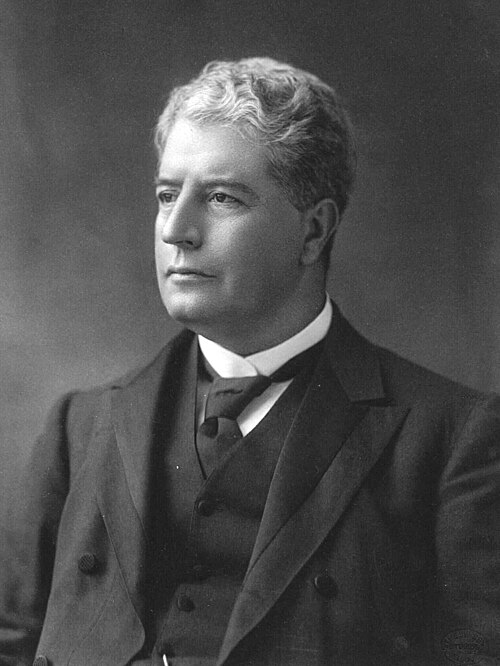
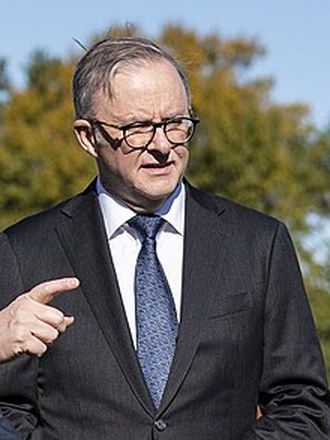
Home › Prime Ministers Prime Ministers of Australia Every prime minister of Australia since Federation in 1901, with portraits, biographies and how the public debt changed while each was in office.
Every prime minister since 1901 31st Prime Minister · In office now
2022–present
30th Prime Minister
2018–2022
29th Prime Minister
2015–2018
28th Prime Minister
2013–2015
26th Prime Minister
2007–2010; 2013
27th Prime Minister
2010–2013
25th Prime Minister
1996–2007
24th Prime Minister
1991–1996
23rd Prime Minister
1983–1991
22nd Prime Minister
1975–1983
21st Prime Minister
1972–1975
20th Prime Minister
1971–1972
19th Prime Minister
1968–1971
18th Prime Minister
1967–1968
17th Prime Minister
1966–1967
12th Prime Minister
1939–1941; 1949–1966
16th Prime Minister
1945–1949
15th Prime Minister
1945
14th Prime Minister
1941–1945
13th Prime Minister
1941
11th Prime Minister
1939
10th Prime Minister
1932–1939
9th Prime Minister
1929–1932
8th Prime Minister
1923–1929
7th Prime Minister
1915–1923
5th Prime Minister
1908–1909; 1910–1913; 1914–1915
6th Prime Minister
1913–1914
2nd Prime Minister
1903–1904; 1905–1908; 1909–1910
4th Prime Minister
1904–1905
3rd Prime Minister
1904
1st Prime Minister
1901–1903
National debt by prime minister How Australia's public debt changed under every prime minister, measured the same way for all of them: as a share of the economy (GDP), and in dollars where GDP figures exist.
Updated 11 Oct 2026 31st Prime Minister · In office now
Debt to GDP, taking office (end-2021) 55.5%
Latest (end-2024) 49.8%
Change so far -5.7 points
Public debt, end-2024 $1.33 trillion Every ministry since 1901 +13.7 pts
Debt to GDP 41.8% → 55.5%
Measured at end-2018 → end-2021
In dollars (at the time) $772.9 billion → $1.16 trillion +4.1 pts
Debt to GDP 37.7% → 41.8%
Measured at end-2015 → end-2018
In dollars (at the time) $614.8 billion → $772.9 billion +7.2 pts
Debt to GDP 30.5% → 37.7%
Measured at end-2013 → end-2015
In dollars (at the time) $470.8 billion → $614.8 billion +3 pts
Debt to GDP 27.5% → 30.5%
Measured at end-2012 → end-2013
In dollars (at the time) $414.1 billion → $470.8 billion +10.9 pts
Debt to GDP 16.6% → 27.5%
Measured at end-2009 → end-2012
In dollars (at the time) $210.1 billion → $414.1 billion +6.9 pts
Debt to GDP 9.7% → 16.6%
Measured at end-2007 → end-2009
In dollars (at the time) $105.8 billion → $210.1 billion -21.4 pts
Debt to GDP 31.1% → 9.7%
Measured at end-1995 → end-2007
In dollars (at the time) $154.4 billion → $105.8 billion +9.5 pts
Debt to GDP 21.6% → 31.1%
Measured at end-1991 → end-1995
In dollars (at the time) $89.8 billion → $154.4 billion +4.8 pts
Debt to GDP 16.8% → 21.6%
Measured at end-1982 → end-1991
In dollars (at the time) $29.6 billion → $89.8 billion -6.8 pts
Debt to GDP 23.6% → 16.8%
Measured at end-1975 → end-1982
In dollars (at the time) $16.8 billion → $29.6 billion -7.1 pts
Debt to GDP 30.7% → 23.6%
Measured at end-1972 → end-1975
In dollars (at the time) $13.7 billion → $16.8 billion -4.2 pts
Debt to GDP 34.9% → 30.7%
Measured at end-1970 → end-1972
In dollars (at the time) $12.9 billion → $13.7 billion -5.6 pts
Debt to GDP 40.5% → 34.9%
Measured at end-1967 → end-1970
In dollars (at the time) $11.0 billion → $12.9 billion +0 pts
Debt to GDP 40.5% → 40.5%
Measured at end-1967 → end-1967
In dollars (at the time) $11.0 billion → $11.0 billion -3.2 pts
Debt to GDP 43.7% → 40.5%
Measured at end-1965 → end-1967
In dollars (at the time) $10.2 billion → $11.0 billion -21.7 pts
Debt to GDP 65.4% → 43.7%
Measured at end-1949 → end-1965 -24.3 pts
Debt to GDP 89.7% → 65.4%
Measured at end-1945 → end-1949 +0 pts
Debt to GDP 89.7% → 89.7%
Measured at end-1945 → end-1945 +23.2 pts
Debt to GDP 66.5% → 89.7%
Measured at end-1941 → end-1945 +0 pts
Debt to GDP 66.5% → 66.5%
Measured at end-1941 → end-1941 -2.2 pts
Debt to GDP 68.7% → 66.5%
Measured at end-1938 → end-1941 +0 pts
Debt to GDP 68.7% → 68.7%
Measured at end-1938 → end-1938 -21.1 pts
Debt to GDP 89.8% → 68.7%
Measured at end-1931 → end-1938 +26 pts
Debt to GDP 63.8% → 89.8%
Measured at end-1929 → end-1931 +0.4 pts
Debt to GDP 63.4% → 63.8%
Measured at end-1922 → end-1929 +19 pts
Debt to GDP 44.4% → 63.4%
Measured at end-1915 → end-1922 +6.3 pts
Debt to GDP 38.1% → 44.4%
Measured at end-1914 → end-1915 +0.7 pts
Debt to GDP 37.4% → 38.1%
Measured at end-1912 → end-1914 -3.2 pts
Debt to GDP 40.6% → 37.4%
Measured at end-1909 → end-1912 -1.8 pts
Debt to GDP 42.4% → 40.6%
Measured at end-1908 → end-1909 +0 pts
Debt to GDP 42.4% → 42.4%
Measured at end-1908 → end-1908 -6.7 pts
Debt to GDP 49.1% → 42.4%
Measured at end-1905 → end-1908 +1.2 pts
Debt to GDP 47.9% → 49.1%
Measured at end-1904 → end-1905 -1.8 pts
Debt to GDP 49.7% → 47.9%
Measured at end-1903 → end-1904 +0 pts
Debt to GDP 49.7% → 49.7%
Measured at end-1903 → end-1903 -1.2 pts
Debt to GDP 50.9% → 49.7%
Measured at end-1900 → end-1903 How this is measured: gross public debt of all levels of government (Commonwealth, state and local combined) as a share of GDP at the year-end nearest each change of prime minister. From 1950 the figures are the IMF Global Debt Database's general government debt; earlier years use the IMF's historical public debt series. Dollar amounts apply that share to the year's GDP (World Bank, from 1960) and are not adjusted for inflation; the share of GDP is the comparable measure. A sitting prime minister is measured to the latest year available. Prime ministers do not borrow alone: Parliament passes every budget, and wars, recessions and interest rates shape the numbers. Updated automatically every month. See the live national debt clock .