Gross debt divided by 27,614,411 people (2025).
Australian Government gross debt · live estimate
Australia's National Debt
$993,758,798,609
Rising by about $2,524 every second, $218.1 million a day, on the way to the Budget's forecast of $1,051.0 billion by 30 June 2027.
Estimate of Australian Government Securities on issue, built from Commonwealth Budget figures. Figures reviewed 11 October 2026.
Since midnight, your time.
Since 1 July; $27.7 billion forecast for the year, about $878 a second.
At 30 June 2026; forecast 34% in 2026–27, peaking at 35.8% in 2028–29.
Federal debt by year
Australian Government debt at 30 June of each financial year. Gross debt is the face value of government securities on issue; net debt subtracts financial assets.
| Year to 30 June | Gross debt | % of GDP | Net debt | % of GDP |
|---|---|---|---|---|
| 2018–19 | $542.0 billion | 27.7% | $373.6 billion | 19.1% |
| 2019–20 | $684.3 billion | 34.4% | $491.2 billion | 24.7% |
| 2020–21 | $817.0 billion | 39.1% | $592.2 billion | 28.3% |
| 2021–22 | $895.3 billion | 38.3% | $515.7 billion | 22.1% |
| 2022–23 | $889.8 billion | 34.5% | $491.0 billion | 19.1% |
| 2023–24 | $906.9 billion | 33.8% | $491.5 billion | 18.3% |
| 2024–25 | $928.6 billion | 33.4% | $532.3 billion | 19.2% |
| 2025–26 | $971.4 billion | 33.2% | – | – |
| 2026–27 (Budget forecast) | $1,051.0 billion | 34% | $616.9 billion | 19.9% |
Federal debt since 1971
Gross and net debt as a share of GDP at 30 June each year, with the 2026–27 Budget forecast. Below zero, the government held more financial assets than debt.
- 1995–96 Net debt peaked at 18.5% of GDP ($96 billion) before a decade of budget surpluses.
- 2006–07 Net debt turned negative for the first time in three decades: the government held more financial assets than debt.
- 2007–13 A legal debt ceiling, set at $75 billion in 2007 and raised to $300 billion by 2012, was repealed in December 2013.
- 2020–21 Pandemic support pushed gross debt to 39.1% of GDP, the highest on this series.
- 2026–27 Gross debt is expected to pass $1 trillion for the first time ($1,051 billion at 30 June 2027).
Show the data for every year
| Year to 30 June | Gross debt | Gross, % of GDP | Net, % of GDP |
|---|---|---|---|
| 1971 | $10.9 billion | 26.9% | 0.9% |
| 1972 | $12.5 billion | 25.8% | -1.1% |
| 1973 | $12.2 billion | 24.5% | -1.6% |
| 1974 | $12.8 billion | 21.2% | -3.1% |
| 1975 | $14.8 billion | 20.7% | -2.7% |
| 1976 | $17.9 billion | 21.5% | -0.4% |
| 1977 | $20.8 billion | 21.6% | 0.9% |
| 1978 | $24.0 billion | 21.6% | 2.8% |
| 1979 | $28.1 billion | 23.6% | 4.2% |
| 1980 | $29.3 billion | 21.8% | 4.6% |
| 1981 | $30.2 billion | 19.8% | 4.2% |
| 1982 | $31.1 billion | 17.6% | 3.4% |
| 1983 | $37.1 billion | 21.2% | 4.8% |
| 1984 | $45.4 billion | 21.2% | 7.5% |
| 1985 | $54.4 billion | 23.1% | 9.3% |
| 1986 | $63.1 billion | 24.2% | 10.3% |
| 1987 | $67.2 billion | 23.4% | 6% |
| 1988 | $62.8 billion | 19.3% | 8.4% |
| 1989 | $56.9 billion | 15.4% | 6% |
| 1990 | $48.7 billion | 11.9% | 4% |
| 1991 | $48.7 billion | 11.7% | 4.1% |
| 1992 | $58.8 billion | 13.9% | 7.3% |
| 1993 | $76.5 billion | 17.2% | 12.4% |
| 1994 | $90.9 billion | 19.5% | 15% |
| 1995 | $105.5 billion | 21.2% | 16.8% |
| 1996 | $110.2 billion | 20.8% | 18.1% |
| 1997 | $111.1 billion | 19.9% | 17.3% |
| 1998 | $93.7 billion | 15.9% | 14.1% |
| 1999 | $85.3 billion | 13.7% | 11.6% |
| 2000 | $75.5 billion | 11.4% | 8.7% |
| 2001 | $66.4 billion | 9.4% | 5.6% |
| 2002 | $63.0 billion | 8.3% | 5.6% |
| 2003 | $57.4 billion | 7.1% | 4.2% |
| 2004 | $54.8 billion | 6.3% | 3.1% |
| 2005 | $55.0 billion | 5.9% | 1.7% |
| 2006 | $54.1 billion | 5.4% | – |
| 2007 | $53.3 billion | 4.9% | -2.2% |
| 2008 | $55.4 billion | 4.7% | -3.4% |
| 2009 | $101.1 billion | 8% | -0.9% |
| 2010 | $147.1 billion | 11.2% | 3.7% |
| 2011 | $191.3 billion | 13.4% | 6.4% |
| 2012 | $234.0 billion | 15.5% | 10.2% |
| 2013 | $257.4 billion | 16.7% | 10.3% |
| 2014 | $319.5 billion | 19.9% | 13% |
| 2015 | $368.7 billion | 22.6% | 15.1% |
| 2016 | $420.4 billion | 25.3% | 18.2% |
| 2017 | $501.0 billion | 28.4% | 18.3% |
| 2018 | $531.9 billion | 28.8% | 18.5% |
| 2019 | $542.0 billion | 27.7% | 19.1% |
| 2020 | $684.3 billion | 34.4% | 24.7% |
| 2021 | $817.0 billion | 39.1% | 28.3% |
| 2022 | $895.3 billion | 38.3% | 22.1% |
| 2023 | $889.8 billion | 34.5% | 19.1% |
| 2024 | $906.9 billion | 33.8% | 18.3% |
| 2025 | $928.6 billion | 33.4% | 19.2% |
| 2026 | $971.4 billion | 33.2% | – |
| 2027 | $1,051.0 billion | 34% | 19.9% |
How Australia compares with the G7
General government gross debt (Commonwealth, state and local together) as a % of GDP, 2025 (IMF). Countries are compared on this basis because the split of responsibilities between levels of government differs from country to country.
State debt
The states borrow separately from the Australian Government. The largest state debts in 2026–27, as net debt (Parliamentary Budget Office):
Net debt of all Australian governments together is forecast to rise from 33.3% to 36.5% of GDP over the PBO's outlook period.
National debt by prime minister
How Australia's public debt changed under every prime minister, measured the same way for all of them: as a share of the economy (GDP), and in dollars where GDP figures exist.
- Debt to GDP, taking office (end-2021)
- 55.5%
- Latest (end-2024)
- 49.8%
- Change so far
- -5.7 points
- Public debt, end-2024
- $1.33 trillion
Earlier prime ministers
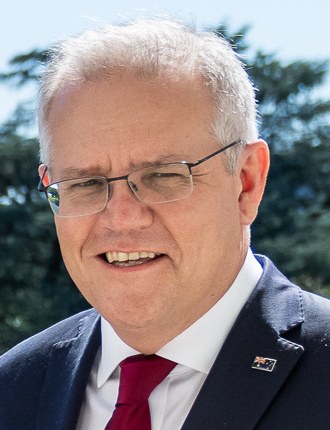
- 30Scott Morrison Liberal · 2018–2022+13.7 pts
- Debt to GDP
- 41.8% → 55.5%
- Measured at
- end-2018 → end-2021
- In dollars (at the time)
- $772.9 billion → $1.16 trillion
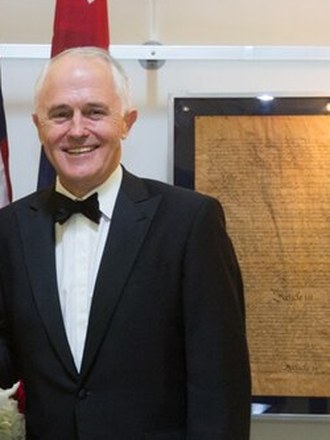
- 29Malcolm Turnbull Liberal · 2015–2018+4.1 pts
- Debt to GDP
- 37.7% → 41.8%
- Measured at
- end-2015 → end-2018
- In dollars (at the time)
- $614.8 billion → $772.9 billion
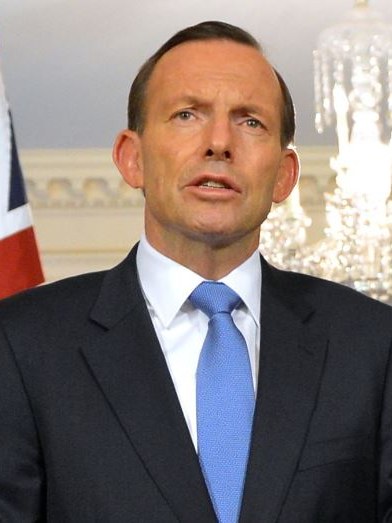
- 28Tony Abbott Liberal · 2013–2015+7.2 pts
- Debt to GDP
- 30.5% → 37.7%
- Measured at
- end-2013 → end-2015
- In dollars (at the time)
- $470.8 billion → $614.8 billion
- 26Kevin Rudd Labor · 2013 · Term 2 of 2+3 pts
- Debt to GDP
- 27.5% → 30.5%
- Measured at
- end-2012 → end-2013
- In dollars (at the time)
- $414.1 billion → $470.8 billion

How these figures are measured
The clock starts from gross debt at 30 June 2026 ($971.4 billion) and rises evenly to the 2026–27 Budget forecast for 30 June 2027 ($1,051.0 billion). Interest follows the Budget's estimate of interest on Australian Government Securities. It is an estimate: actual issuance happens in weekly bond and Treasury note tenders by the Australian Office of Financial Management, so the real figure moves in steps.
Gross debt is the face value of Australian Government Securities on issue: Treasury Bonds, Treasury Indexed Bonds and Treasury Notes. Net debt subtracts the government's cash, deposits, loans and investments. The Future Fund's assets are not netted off.
International comparisons use the IMF's general government measure, which adds state and local government debt and counts all liabilities, so it is higher than the Commonwealth figures above.
The Budget figures on this page are reviewed with each Budget, Mid-Year Economic and Fiscal Outlook and Final Budget Outcome; IMF and World Bank data refresh automatically every month.
Sources
- Budget 2026–27, Budget Paper No. 1 (Commonwealth of Australia)
- Budget 2026–27, Statement 7: Debt Statement
- Parliamentary Budget Office, 2026–27 National Fiscal Outlook
- Parliamentary Budget Office, 2026–27 Medium-Term Budget Outlook
- Australian Office of Financial Management
- IMF World Economic Outlook database
Frequently asked questions
How much is Australia's national debt?
The Australian Government's gross debt (Australian Government Securities on issue) was about $971.4 billion at 30 June 2026 and is forecast in the 2026–27 Budget to reach $1,051.0 billion, or 34% of GDP, by 30 June 2027. The clock on this page estimates it continuously between those points.
How fast is the debt growing?
Gross debt is forecast to rise by $79.6 billion over 2026–27, about $2,524 every second or $218.1 million a day. The underlying cash deficit for the year is forecast at $31.5 billion.
How much debt is there per Australian?
About $35,987 per person, dividing the estimated gross debt by Australia's population (27,614,411 people in 2025).
How much interest does the government pay?
Interest on Australian Government Securities is estimated at $27.7 billion in 2026–27, rising to $40.4 billion by 2029–30 as debt grows and older, cheaper bonds are refinanced at higher rates.
What is the difference between gross debt and net debt?
Gross debt is the face value of all Australian Government Securities on issue. Net debt subtracts the government's financial assets such as cash, deposits, loans and investments; it is forecast at $616.9 billion (19.9% of GDP) in 2026–27. Assets of the Future Fund are not counted against net debt.
Does this include state government debt?
No. The clock covers the Australian (Commonwealth) Government only. The states borrow separately: Victoria's net debt is about $215 billion and New South Wales's about $195 billion in 2026–27, and net debt of all Australian governments together is forecast to rise from 33.3% to 36.5% of GDP over the Parliamentary Budget Office's outlook.